TOC
Open TOC
- Assignment 1
- Program 1: Parallel Fractal Generation Using Threads (20 points)
- Program 2: Vectorizing Code Using SIMD Intrinsics (20 points)
- Program 3: Parallel Fractal Generation Using ISPC (20 points)
- Program 4: Iterative
sqrt(15 points) - Program 5: BLAS
saxpy(10 points) - Program 6: Making
K-MeansFaster (15 points)
- Assignment 2
- Assignment 3
- Assignment 4
Assignment 1
- time
after 04 prog basics
- env
> screenfetch
 ██████████████████  ████████     vgalaxy@vgalaxy-virtualbox ██████████████████  ████████     OS: Manjaro 22.0.0 Sikaris ██████████████████  ████████     Kernel: x86_64 Linux 5.15.72-1-MANJARO ██████████████████  ████████     Uptime: 50m ████████            ████████     Packages: 1256 ████████  ████████  ████████     Shell: zsh 5.9 ████████  ████████  ████████     Resolution: 1920x964 ████████  ████████  ████████     DE: GNOME 42.3 ████████  ████████  ████████     WM: Mutter ████████  ████████  ████████     WM Theme: ████████  ████████  ████████     GTK Theme: Adw-dark [GTK2/3] ████████  ████████  ████████     Icon Theme: Papirus-Dark ████████  ████████  ████████     Font: Noto Sans 11 ████████  ████████  ████████     Disk: 56G / 83G (71%)                                  CPU: Intel Core i7-10875H @ 8x 2.304GHz                                  GPU: llvmpipe (LLVM 14.0.6, 256 bits)                                  RAM: 3778MiB / 7947MiB
> cat /proc/cpuinfoprocessor       : 0vendor_id       : GenuineIntelcpu family      : 6model           : 165model name      : Intel(R) Core(TM) i7-10875H CPU @ 2.30GHzstepping        : 2cpu MHz         : 2303.998cache size      : 16384 KBphysical id     : 0siblings        : 8core id         : 0cpu cores       : 8apicid          : 0initial apicid  : 0fpu             : yesfpu_exception   : yescpuid level     : 22wp              : yesflags           : fpu vme de pse tsc msr pae mce cx8 apic sep mtrr pge mca cmov pat pse36 clflush mmx fxsr sse sse2 ht syscall nx rdtscp lm constant_tsc rep_good nopl xtopology nonstop_tsc cpuid tsc_known_freq pni pclmulqdq ssse3 cx16 pcid sse4_1 sse4_2 x2apic movbe popcnt aes xsave avx rdrand hypervisor lahf_lm abm 3dnowprefetch invpcid_single fsgsbase avx2 invpcid rdseed clflushopt md_clear flush_l1d arch_capabilitiesbugs            : spectre_v1 spectre_v2 spec_store_bypass swapgs itlb_multihit srbds mmio_stale_data retbleedbogomips        : 4609.99clflush size    : 64cache_alignment : 64address sizes   : 39 bits physical, 48 bits virtualpower management:...
Program 1: Parallel Fractal Generation Using Threads (20 points)
使用 std::thread 库进行 assignment,assignment 只需按行平均划分即可,注意除法计算的误差
由于 thread #0 会等待其余线程 join,所以一般而言耗时最长
> ./mandelbrot -t 2 -v 2[mandelbrot serial]: [249.444] msWrote image file mandelbrot-serial.ppm[mandelbrot thread #01]: [0.113] ms[mandelbrot thread #00]: [0.153] ms[mandelbrot thread #01]: [0.110] ms[mandelbrot thread #00]: [0.152] ms[mandelbrot thread #01]: [0.135] ms[mandelbrot thread #00]: [0.171] ms[mandelbrot thread #01]: [0.112] ms[mandelbrot thread #00]: [0.154] ms[mandelbrot thread #01]: [0.109] ms[mandelbrot thread #00]: [0.151] ms[mandelbrot thread]: [151.544] msWrote image file mandelbrot-thread.ppm (1.65x speedup from 2 threads)下面是一些数据
> ./mandelbrot -t 2 -v 2[mandelbrot serial]: [248.491] msWrote image file mandelbrot-serial.ppm[mandelbrot thread]: [147.886] msWrote image file mandelbrot-thread.ppm (1.68x speedup from 2 threads)> ./mandelbrot -t 3 -v 2[mandelbrot serial]: [251.135] msWrote image file mandelbrot-serial.ppm[mandelbrot thread]: [113.363] msWrote image file mandelbrot-thread.ppm (2.22x speedup from 3 threads)> ./mandelbrot -t 4 -v 2[mandelbrot serial]: [249.733] msWrote image file mandelbrot-serial.ppm[mandelbrot thread]: [95.561] msWrote image file mandelbrot-thread.ppm (2.61x speedup from 4 threads)> ./mandelbrot -t 5 -v 2[mandelbrot serial]: [249.757] msWrote image file mandelbrot-serial.ppm[mandelbrot thread]: [84.263] msWrote image file mandelbrot-thread.ppm (2.96x speedup from 5 threads)> ./mandelbrot -t 6 -v 2[mandelbrot serial]: [250.032] msWrote image file mandelbrot-serial.ppm[mandelbrot thread]: [73.146] msWrote image file mandelbrot-thread.ppm (3.42x speedup from 6 threads)> ./mandelbrot -t 7 -v 2[mandelbrot serial]: [249.426] msWrote image file mandelbrot-serial.ppm[mandelbrot thread]: [64.983] msWrote image file mandelbrot-thread.ppm (3.84x speedup from 7 threads)> ./mandelbrot -t 8 -v 2[mandelbrot serial]: [249.807] msWrote image file mandelbrot-serial.ppm[mandelbrot thread]: [59.706] msWrote image file mandelbrot-thread.ppm (4.18x speedup from 8 threads)> ./mandelbrot -t 16 -v 2[mandelbrot serial]: [249.328] msWrote image file mandelbrot-serial.ppm[mandelbrot thread]: [40.238] msWrote image file mandelbrot-thread.ppm (6.20x speedup from 16 threads)> ./mandelbrot -t 32 -v 2[mandelbrot serial]: [249.752] msWrote image file mandelbrot-serial.ppm[mandelbrot thread]: [36.408] msWrote image file mandelbrot-thread.ppm (6.86x speedup from 32 threads)Program 2: Vectorizing Code Using SIMD Intrinsics (20 points)
使用模拟的向量指令进行运算,每个向量指令都有一个 mask 参数,用来表示向量中的哪些位会参与运算
例如,对于如下的向量指令
void _cs149_vadd_int(__cs149_vec_int &vecResult, __cs149_vec_int &veca, __cs149_vec_int &vecb, __cs149_mask &mask);只有 veca 和 vecb 中 mask 为 1 的位会相加,其结果保存在 vecResult 对应的位中,否则 vecResult 对应的位保持不变
也可以通过向量指令构造 mask,例如
void _cs149_veq_int(__cs149_mask &vecResult, __cs149_vec_int &veca, __cs149_vec_int &vecb, __cs149_mask &mask);只有 veca 和 vecb 中对应的位相同,vecResult 中 mask 对应的位才会置为 1,否则置为 0
仍然在 mask 参数的语义下执行上述操作
由此实现 clampedExpVector 就不困难了,另外,考虑到 N 不一定为 VECTOR_WIDTH 的部分,所以需要对 underflow 和 overflow 情形下的 mask all 进行调整
下面对向量指令的性能进行分析,当 Vector Width 增加时,会发现 Vector Utilization 会降低
> ./myexp -s 10000****************** Printing Vector Unit Statistics *******************Vector Width:              2Total Vector Instructions: 218409Vector Utilization:        87.5%Utilized Vector Lanes:     382241Total Vector Lanes:        436818
> ./myexp -s 10000****************** Printing Vector Unit Statistics *******************Vector Width:              4Total Vector Instructions: 125719Vector Utilization:        85.5%Utilized Vector Lanes:     430081Total Vector Lanes:        502876
> ./myexp -s 10000****************** Printing Vector Unit Statistics *******************Vector Width:              8Total Vector Instructions: 68284Vector Utilization:        84.6%Utilized Vector Lanes:     462157Total Vector Lanes:        546272
> ./myexp -s 10000****************** Printing Vector Unit Statistics *******************Vector Width:              16Total Vector Instructions: 35584Vector Utilization:        84.2%Utilized Vector Lanes:     479417Total Vector Lanes:        569344
这是因为在 while 循环的次数取决于向量中最大的 exp,当 Vector Width 增加时,较大的 exp 所在的位就会波及更多的位,导致利用率降低
以 Vector Width = 16 为例
> ./myexp -l***************** Printing Vector Unit Execution Log ***************** Instruction | Vector Lane Occupancy ('*' for active, '_' for inactive)------------- -------------------------------------------------------- vset | **************** vset | **************** vset | **************** vset | **************** vload | **************** vload | **************** veq | **************** vmove | ____________*___ masknot | **************** vmove | ************_*** vsub | ************_*** maskand | **************** cntbits | **************** vgt | ************_*** maskand | **************** vmult | ****_*******_*** vsub | ************_*** cntbits | **************** vgt | ************_*** maskand | **************** vmult | ***__*******_**_ vsub | ************_*** cntbits | **************** vgt | ************_*** maskand | **************** vmult | ***__*******__*_ vsub | ************_*** cntbits | **************** vgt | ************_*** maskand | **************** vmult | ***__*******__*_ vsub | ************_*** cntbits | **************** vgt | ************_*** maskand | **************** vmult | *____*******____ vsub | ************_*** cntbits | **************** vgt | ************_*** maskand | **************** vmult | _____**___**____ vsub | ************_*** cntbits | **************** vgt | ************_*** maskand | **************** vmult | ______*___**____ vsub | ************_*** cntbits | **************** vgt | ************_*** maskand | **************** vmult | ______*____*____ vsub | ************_*** cntbits | **************** vgt | ************_*** maskand | **************** vmult | ________________ vsub | ************_*** cntbits | **************** vmove | ************_*** vgt | **************** vmove | ***____**_____*_ vstore | ****************可以观察到 vmult 指令的后期 * 的比例越来越低
对于 arraySumVector,只需利用 _cs149_hadd_float 和 _cs149_interleave_float 将向量元素和放置在向量的开头即可
Program 3: Parallel Fractal Generation Using ISPC (20 points)
安装 ispc
yay -S ispc-binProgram 3, Part 1. A Few ISPC Basics (10 of 20 points)
示例程序改编自 https://ispc.github.io/example.html
运行结果如下
> ./mandelbrot_ispc[mandelbrot serial]:            [185.266] msWrote image file mandelbrot-serial.ppm[mandelbrot ispc]:              [39.082] msWrote image file mandelbrot-ispc.ppm                                (4.74x speedup from ISPC)
> ./mandelbrot_ispc -v 2[mandelbrot serial]:            [116.578] msWrote image file mandelbrot-serial.ppm[mandelbrot ispc]:              [29.948] msWrote image file mandelbrot-ispc.ppm                                (3.89x speedup from ISPC)
与 prog1 中 ./mandelbrot -t 8 -v 2 加速比相近
观察编译 ispc 程序的命令
ispc -O3 --target=avx2-i32x8 --arch=x86-64 --opt=disable-fma --pic mandelbrot.ispc -o objs/mandelbrot_ispc.o -h objs/mandelbrot_ispc.h其中的参数可以参考 https://ispc.github.io/ispc.html#basic-command-line-options,或者 ispc --help
将 --target=avx2-i32x8 改为 --target=avx2-i32x16,加速比进一步提升,此处的 8 和 16 类似 prog2 中的 VECTOR_WIDTH
> ./mandelbrot_ispc -v 2[mandelbrot serial]: [117.725] msWrote image file mandelbrot-serial.ppm[mandelbrot ispc]: [18.595] msWrote image file mandelbrot-ispc.ppm (6.33x speedup from ISPC)这里 --opt=disable-fma 是关键的,否则可能会导致计算出错
Program 3, Part 2: ISPC Tasks (10 of 20 points)
之前的 notes 中忘记介绍了 ispc tasks
- The ISPC gang abstraction is implemented by SIMD instructions on one core.
- ISPC contains another abstraction: a task that is used to achieve multi-core execution.
使用关键字 launch 抽象 ispc tasks
export void mandelbrot_ispc_withtasks(uniform float x0, uniform float y0,                                      uniform float x1, uniform float y1,                                      uniform int width, uniform int height,                                      uniform int maxIterations,                                      uniform int output[]){
    uniform int rowsPerTask = height / 16;
    // create 16 tasks    launch[16] mandelbrot_ispc_task(x0, y0, x1, y1,                                     width, height,                                     rowsPerTask,                                     maxIterations,                                     output);}
思考:关键字 launch 和关键字 foreach 的区别
使用了 ispc tasks 后,加速比进一步提升,下面结果的 tasks 依次为 2, 4, 8, 16, 32
> ./mandelbrot_ispc -v 2 --tasks[mandelbrot serial]:            [128.511] msWrote image file mandelbrot-serial.ppm[mandelbrot ispc]:              [28.792] msWrote image file mandelbrot-ispc.ppm[mandelbrot multicore ispc]:    [16.295] msWrote image file mandelbrot-task-ispc.ppm                                (4.46x speedup from ISPC)                                (7.89x speedup from task ISPC)
> ./mandelbrot_ispc -v 2 --tasks[mandelbrot serial]:            [125.069] msWrote image file mandelbrot-serial.ppm[mandelbrot ispc]:              [28.750] msWrote image file mandelbrot-ispc.ppm[mandelbrot multicore ispc]:    [11.636] msWrote image file mandelbrot-task-ispc.ppm                                (4.35x speedup from ISPC)                                (10.75x speedup from task ISPC)
> ./mandelbrot_ispc -v 2 --tasks[mandelbrot serial]:            [125.179] msWrote image file mandelbrot-serial.ppm[mandelbrot ispc]:              [30.252] msWrote image file mandelbrot-ispc.ppm[mandelbrot multicore ispc]:    [7.951] msWrote image file mandelbrot-task-ispc.ppm                                (4.14x speedup from ISPC)                                (15.74x speedup from task ISPC)
> ./mandelbrot_ispc -v 2 --tasks[mandelbrot serial]:            [117.844] msWrote image file mandelbrot-serial.ppm[mandelbrot ispc]:              [27.866] msWrote image file mandelbrot-ispc.ppm[mandelbrot multicore ispc]:    [5.914] msWrote image file mandelbrot-task-ispc.ppm                                (4.23x speedup from ISPC)                                (19.93x speedup from task ISPC)
> ./mandelbrot_ispc -v 2 --tasks[mandelbrot serial]:            [117.066] msWrote image file mandelbrot-serial.ppm[mandelbrot ispc]:              [27.534] msWrote image file mandelbrot-ispc.ppm[mandelbrot multicore ispc]:    [5.250] msWrote image file mandelbrot-task-ispc.ppm                                (4.25x speedup from ISPC)                                (22.30x speedup from task ISPC)
使用 avx2-i32x16 和 32 tasks,加速比已经达到了 34x 😲
> ./mandelbrot_ispc -v 2 --tasks[mandelbrot serial]: [116.469] msWrote image file mandelbrot-serial.ppm[mandelbrot ispc]: [17.689] msWrote image file mandelbrot-ispc.ppm[mandelbrot multicore ispc]: [3.413] msWrote image file mandelbrot-task-ispc.ppm (6.58x speedup from ISPC) (34.13x speedup from task ISPC)由于 cpu 不支持 avx512,所以就不进一步加速了
相较于 prog1 中 32 threads,这里还利用了向量指令带来的加速,另外,ispc task 的 schedule 也比手动 join thread 更加高效
Program 4: Iterative sqrt (15 points)
avx2-i32x8 + 64 tasks,加速比如下
> ./sqrt[sqrt serial]: [665.442] ms[sqrt ispc]: [146.958] ms[sqrt task ispc]: [23.555] ms (4.53x speedup from ISPC) (28.25x speedup from task ISPC)其中
- SIMD parallelization 加速比为 4.53
- multi-core parallelization 加速比为 6.24
下面需要构造输入用例来最大化或最小化加速比
置输入用例全为 1,加速比如下
> ./sqrt[sqrt serial]: [15.509] ms[sqrt ispc]: [8.151] ms[sqrt task ispc]: [8.114] ms (1.90x speedup from ISPC) (1.91x speedup from task ISPC)其中
- SIMD parallelization 加速比为 1.90
- multi-core parallelization 加速比为 1
置输入用例全为 2.998,加速比如下
> ./sqrt[sqrt serial]: [1549.775] ms[sqrt ispc]: [223.970] ms[sqrt task ispc]: [38.122] ms (6.92x speedup from ISPC) (40.65x speedup from task ISPC)其中
- SIMD parallelization 加速比为 6.92
- multi-core parallelization 加速比为 5.87
一些思考
- 由于 1 和 2.998 分别是范围内迭代次数的两个极值,迭代次数越少,代表浮点运算越少,SIMD 的作用就越小
- 当每个 task 所用的时间过小时,multi-core 的作用就无法发挥了,例如在输入用例全为 1 的情形中,每个 task 估算所需时间仅为 15.509 / 64 = 0.24ms,可能已经远小于实现 task 抽象所需的开销
- 若 task 的实现手段为 notes 中所述,即通过 queue 来实现,那么数据的分布也许并不重要
最后,使用 AVX2 intrinsics 来编写一个 sqrt 程序,参考 Intel Intrinsics Guide
有一些要点
- load 时,
_mm256_load_ps要求地址 32 位对齐,_mm256_loadu_ps则不要求,store 同理 _mm256_cmp_ps会传入一个 op 参数,其中包含 32 种比较规则,主要是为了处理 nan 问题- 具体 RTFM -> Comparison Predicate for CMPPD and CMPPS Instructions
- AVX2 intrinsics 中的 mask 没有 prog2 中那么灵活,所以对于分支和循环语句,需要使用一些技巧
- 例如 abs 的实现利用了
_mm256_blendv_ps指令 - 循环则考虑到牛顿迭代法的收敛性,即使已经在 threshold 内,多一轮计算也不会降低精度,所以所有的位都进行相同次数的迭代计算
- 例如 abs 的实现利用了
最后的结果如下
> ./sqrt[sqrt serial]: [669.400] ms[sqrt avx]: [136.881] ms[sqrt ispc]: [150.825] ms[sqrt task ispc]: [23.403] ms (4.89x speedup from AVX) (4.44x speedup from ISPC) (28.60x speedup from task ISPC)比 ispc 生成的向量指令更加高效,毕竟是手写的 🤣
Program 5: BLAS saxpy (10 points)
avx2-i32x8 + 64 tasks,结果如下
> ./saxpy[saxpy ispc]: [10.886] ms [27.376] GB/s [3.674] GFLOPS[saxpy task ispc]: [12.660] ms [23.540] GB/s [3.159] GFLOPS (0.86x speedup from use of tasks)发现了用了 task 反而变慢了,猜测因为 saxpy 的核心计算只使用 fma 指令即可实现,所以维护 task 抽象的开销和内存带宽会成为瓶颈
result[i] = scale * X[i] + Y[i];这里还计算了 bandwidth 和 gflops,其中认为,在整个计算中
TOTAL_BYTES = 4 * N * sizeof(float);TOTAL_FLOPS = 2 * N;一次计算中的两次浮点运算可以理解,TOTAL_BYTES 中的 4 需要考虑 cache
FROM PKUFlyingPig:
When the program writes to one element of
result, it will first fetch the cache line which contains this element into the cache. This requires one memory operation. Then when this cache line is not needed, it will be flashed out of the cache, this requires another memory operation.
Program 6: Making K-Means Faster (15 points)
没数据哎……
Assignment 2
after 07 prog perf 2
Ref
Test
测试主要分为两部分,一部分是以 tests/main.cpp 为入口的正确性测试,另一部分是以 tests/run_test_harness.py 为入口的性能测试
tests/main.cpp中会以不同的ITaskSystem为参数,调用不同的测试函数,并获取TestResults,其中包含了测试正确性和测试耗时
./runtasks -n 8 mandelbrot_chunkedtests/run_test_harness.py则另外还会调用参考实现,若耗时在参考实现的 1.2 倍之内,则认为性能测试通过
python3 ../tests/run_test_harness.py -t simple_test_sync ping_pong_equal ping_pong_unequal super_light super_super_light recursive_fibonacci math_operations_in_tight_for_loop math_operations_in_tight_for_loop_fewer_tasks math_operations_in_tight_for_loop_fan_in math_operations_in_tight_for_loop_reduction_tree spin_between_run_calls mandelbrot_chunked若要测试异步版本,需要添加 -a 参数,工作路径在 part_b 文件夹中
Part A
需要完成 ITaskSystem 的如下三个版本
TaskSystemParallelSpawn
由于最多只能使用 num_threads 个线程,所以只需在 run 函数中分批 spawn thread 然后 join 即可,此时不考虑 thread 的复用
TaskSystemParallelThreadPoolSpinning
需要考虑 thread 的复用,于是需要实现一个简单的线程池
线程池中 task 的型别固定为 void(),所以不必和复杂的模板语法打交道
为了能够在 run 函数中监控 task 是否完成,考虑使用 packaged_task 和 future 这两个并发标准库原语,当所有的任务均已 submit 且正在执行时,就可以安全的访问 future queue,future queue 会在 worker thread 执行 task 前更新
对 future 调用 get 会阻塞当前线程,所以 run 函数的这一部分并非 busy loop
使用 mutex 保护对 task queue 和 future queue 的并发访问,其范式如下
while (true) { mu.lock(); if (!qu.empty()) { // do something for qu } mu.unlock(); std::this_thread::yield();}这里使用了 yield,所以是 busy loop,会在下一部分中优化
还有一些细节
- 构造函数中 worker thread 的初始化,需要传递 this 参数
threads_.push_back(std::thread(&TaskSystemParallelThreadPoolSpinning::worker_thread, this));- submit work 时使用
=捕获runTask的参数
TaskSystemParallelThreadPoolSleeping
这一部分大量参考了基于 C++11 实现线程池
首先为了方便,需要封装一个并发安全的 queue,用于存放 task
另外,worker thread 中会 wait 一个条件变量,当 run 函数中 submit 一个任务时,会唤醒一个 worker thread
auto task_ptr = std::make_shared<std::packaged_task<void()>>( [=] { runnable->runTask(i, num_total_tasks); });std::function<void()> warpper_func = [task_ptr]() { (*task_ptr)(); };task_queue_.enqueue(warpper_func);task_queue_cv_.notify_one();future_queue_.emplace(task_ptr->get_future());其次,优化了更新 future queue 的位置,在 run 函数中更新而非 worker thread 中
比较 tricky 的一个地方是 clean up 的过程
在原来的实现中,考虑使用 atomic<bool> 类型的变量表示线程池是否关闭,在析构函数中唤醒所有的 worker threads,并执行 join
然而存在如下的情形,对于 worker thread,当执行到第 4 行时,发现 done 为 false 且 queue 为空,于是准备执行第 5 行
while (!done_) { { std::unique_lock<std::mutex> lock(task_queue_mu_); while (task_queue_.empty() && !done_) { task_queue_cv_.wait(lock); } dequeued = task_queue_.dequeue(func); } if (dequeued) { func(); }}此时调度到主线程,置 done 为 true 且唤醒所有的 worker threads,并 join 该线程
此时再调度到此线程,执行 wait,该线程就无法被唤醒了,出现死锁
由于主线程 join 子线程时会阻塞,所以没有办法再次唤醒
于是考虑使用 wait_for 替代 wait,由于 clean up 的过程并不计入总时间,若 wait for 的时间足够长,基本上不会影响性能
出现上述现象的本质原因是一个条件变量起到了两种作用
- 队列是否为空
- 线程池是否关闭
如果能够解耦,也许就不会出现上述问题了
Result
性能测试结果如下
================================================================================Running task system grading harness... (11 total tests) - Detected CPU with 8 execution contexts - Task system configured to use at most 8 threads================================================================================================================================================================Executing test: super_super_light...Reference binary: ./runtasks_ref_linuxResults for: super_super_light STUDENT REFERENCE PERF?[Serial] 6.243 6.289 0.99 (OK)[Parallel + Always Spawn] 673.277 107.176 6.28 (NOT OK)[Parallel + Thread Pool + Spin] 46.542 25.794 1.80 (NOT OK)[Parallel + Thread Pool + Sleep] 80.643 29.738 2.71 (NOT OK)================================================================================Executing test: super_light...Reference binary: ./runtasks_ref_linuxResults for: super_light STUDENT REFERENCE PERF?[Serial] 56.501 57.531 0.98 (OK)[Parallel + Always Spawn] 697.43 125.474 5.56 (NOT OK)[Parallel + Thread Pool + Spin] 35.857 33.212 1.08 (OK)[Parallel + Thread Pool + Sleep] 76.662 30.164 2.54 (NOT OK)================================================================================Executing test: ping_pong_equal...Reference binary: ./runtasks_ref_linuxResults for: ping_pong_equal STUDENT REFERENCE PERF?[Serial] 904.174 919.997 0.98 (OK)[Parallel + Always Spawn] 882.033 236.661 3.73 (NOT OK)[Parallel + Thread Pool + Spin] 179.942 184.491 0.98 (OK)[Parallel + Thread Pool + Sleep] 194.083 169.073 1.15 (OK)================================================================================Executing test: ping_pong_unequal...Reference binary: ./runtasks_ref_linuxResults for: ping_pong_unequal STUDENT REFERENCE PERF?[Serial] 1628.283 1663.599 0.98 (OK)[Parallel + Always Spawn] 980.627 358.202 2.74 (NOT OK)[Parallel + Thread Pool + Spin] 301.565 298.065 1.01 (OK)[Parallel + Thread Pool + Sleep] 285.468 280.122 1.02 (OK)================================================================================Executing test: recursive_fibonacci...Reference binary: ./runtasks_ref_linuxResults for: recursive_fibonacci STUDENT REFERENCE PERF?[Serial] 893.467 1263.774 0.71 (OK)[Parallel + Always Spawn] 385.19 189.118 2.04 (NOT OK)[Parallel + Thread Pool + Spin] 149.51 204.019 0.73 (OK)[Parallel + Thread Pool + Sleep] 142.117 186.332 0.76 (OK)================================================================================Executing test: math_operations_in_tight_for_loop...Reference binary: ./runtasks_ref_linuxResults for: math_operations_in_tight_for_loop STUDENT REFERENCE PERF?[Serial] 699.348 701.187 1.00 (OK)[Parallel + Always Spawn] 1020.442 508.353 2.01 (NOT OK)[Parallel + Thread Pool + Spin] 202.333 215.601 0.94 (OK)[Parallel + Thread Pool + Sleep] 246.562 219.489 1.12 (OK)================================================================================Executing test: math_operations_in_tight_for_loop_fewer_tasks...Reference binary: ./runtasks_ref_linuxResults for: math_operations_in_tight_for_loop_fewer_tasks STUDENT REFERENCE PERF?[Serial] 696.272 700.483 0.99 (OK)[Parallel + Always Spawn] 797.813 485.306 1.64 (NOT OK)[Parallel + Thread Pool + Spin] 239.505 243.286 0.98 (OK)[Parallel + Thread Pool + Sleep] 272.237 270.787 1.01 (OK)================================================================================Executing test: math_operations_in_tight_for_loop_fan_in...Reference binary: ./runtasks_ref_linuxResults for: math_operations_in_tight_for_loop_fan_in STUDENT REFERENCE PERF?[Serial] 369.658 368.772 1.00 (OK)[Parallel + Always Spawn] 522.272 106.377 4.91 (NOT OK)[Parallel + Thread Pool + Spin] 77.449 77.174 1.00 (OK)[Parallel + Thread Pool + Sleep] 85.46 73.101 1.17 (OK)================================================================================Executing test: math_operations_in_tight_for_loop_reduction_tree...Reference binary: ./runtasks_ref_linuxResults for: math_operations_in_tight_for_loop_reduction_tree STUDENT REFERENCE PERF?[Serial] 369.786 384.031 0.96 (OK)[Parallel + Always Spawn] 129.87 76.565 1.70 (NOT OK)[Parallel + Thread Pool + Spin] 67.842 71.859 0.94 (OK)[Parallel + Thread Pool + Sleep] 64.901 62.265 1.04 (OK)================================================================================Executing test: spin_between_run_calls...Reference binary: ./runtasks_ref_linuxResults for: spin_between_run_calls STUDENT REFERENCE PERF?[Serial] 315.139 458.11 0.69 (OK)[Parallel + Always Spawn] 162.345 233.455 0.70 (OK)[Parallel + Thread Pool + Spin] 182.367 265.183 0.69 (OK)[Parallel + Thread Pool + Sleep] 163.849 236.194 0.69 (OK)================================================================================Executing test: mandelbrot_chunked...Reference binary: ./runtasks_ref_linuxResults for: mandelbrot_chunked STUDENT REFERENCE PERF?[Serial] 373.527 378.335 0.99 (OK)[Parallel + Always Spawn] 66.077 56.558 1.17 (OK)[Parallel + Thread Pool + Spin] 58.571 62.57 0.94 (OK)[Parallel + Thread Pool + Sleep] 54.34 55.382 0.98 (OK)================================================================================Overall performance results[Serial] : All passed Perf[Parallel + Always Spawn] : Perf did not pass all tests[Parallel + Thread Pool + Spin] : Perf did not pass all tests[Parallel + Thread Pool + Sleep] : Perf did not pass all tests由于没有考虑优化 TaskSystemParallelSpawn,所以其性能并不理想
有如下一些观察
- Thread Pool Spin 和 Thread Pool Sleep 的性能差距并不明显
对于 long task,例如 ping_pong_unequal,Sleep 才有一些优势
- 对于 small task,例如
super_super_light,Serial Task System 比 Parallel Task System 的性能更好
这是因为维护 task system 的开销成为了瓶颈
- 一些测试用例,例如
spin_between_run_calls和mandelbrot_chunked,Always Spawn 与 Thread Pool 的性能相当
对于 spin_between_run_calls,可能的原因已经写在了注释里面
// Notice that since the number of tasks is small, only a small// number of available threads can perform work here, while the// rest spin.对于 mandelbrot_chunked,可能的原因是 task workload 比较平衡,所以 Always Spawn 中 thread 的利用率并不比 Thread Pool 差
- 最后,可以发现 TaskSystemParallelSpawn 的策略为 static assignment,而线程池的策略为 dynamic assignment
Part B
仅修改 TaskSystemParallelThreadPoolSleeping 的实现,使其支持异步 run,并调度存在依赖关系的 task
正确实现并不复杂,考虑引入 scheduler thread 和 ready task queue
- 异步 run 中 submit 的 task 会首先置入 task queue
- scheduler thread 则会判断每个 task 的依赖关系是否满足,若满足,则将 task 置入 ready task queue,否则直接放回 task queue
- worker thread 只会从 ready task queue 中获取 task,当 task 执行完成后,会更新相关的数据结构
对于依赖关系的记录,使用如下的数据结构进行简单的模拟
std::vector<{id, num_total_tasks, finished_tasks}>其中的 id 为 TaskID 类型,即异步 run 函数的返回类型,需要与 runTask 的参数 task_id 区分
此时的同步 run 函数就可以通过异步 run 函数和 sync 函数实现
性能测试结果如下
================================================================================Running task system grading harness... (11 total tests) - Detected CPU with 8 execution contexts - Task system configured to use at most 8 threads================================================================================================================================================================Executing test: super_super_light_async...Reference binary: ./runtasks_ref_linuxResults for: super_super_light_async STUDENT REFERENCE PERF?[Serial] 6.099 6.228 0.98 (OK)[Parallel + Always Spawn] 5.905 106.762 0.06 (OK)[Parallel + Thread Pool + Spin] 6.595 25.646 0.26 (OK)[Parallel + Thread Pool + Sleep] 634.362 10.897 58.21 (NOT OK)================================================================================Executing test: super_light_async...Reference binary: ./runtasks_ref_linuxResults for: super_light_async STUDENT REFERENCE PERF?[Serial] 56.418 57.362 0.98 (OK)[Parallel + Always Spawn] 56.383 120.668 0.47 (OK)[Parallel + Thread Pool + Spin] 63.654 26.483 2.40 (NOT OK)[Parallel + Thread Pool + Sleep] 722.975 28.171 25.66 (NOT OK)================================================================================Executing test: ping_pong_equal_async...Reference binary: ./runtasks_ref_linuxResults for: ping_pong_equal_async STUDENT REFERENCE PERF?[Serial] 913.298 931.521 0.98 (OK)[Parallel + Always Spawn] 911.16 235.139 3.87 (NOT OK)[Parallel + Thread Pool + Spin] 1048.457 189.585 5.53 (NOT OK)[Parallel + Thread Pool + Sleep] 914.774 175.214 5.22 (NOT OK)================================================================================Executing test: ping_pong_unequal_async...Reference binary: ./runtasks_ref_linuxResults for: ping_pong_unequal_async STUDENT REFERENCE PERF?[Serial] 1641.079 1673.688 0.98 (OK)[Parallel + Always Spawn] 1641.178 354.939 4.62 (NOT OK)[Parallel + Thread Pool + Spin] 1898.547 317.095 5.99 (NOT OK)[Parallel + Thread Pool + Sleep] 970.493 284.24 3.41 (NOT OK)================================================================================Executing test: recursive_fibonacci_async...Reference binary: ./runtasks_ref_linuxResults for: recursive_fibonacci_async STUDENT REFERENCE PERF?[Serial] 902.116 1280.551 0.70 (OK)[Parallel + Always Spawn] 900.286 190.191 4.73 (NOT OK)[Parallel + Thread Pool + Spin] 1027.269 200.316 5.13 (NOT OK)[Parallel + Thread Pool + Sleep] 154.708 185.133 0.84 (OK)================================================================================Executing test: math_operations_in_tight_for_loop_async...Reference binary: ./runtasks_ref_linuxResults for: math_operations_in_tight_for_loop_async STUDENT REFERENCE PERF?[Serial] 702.094 705.272 1.00 (OK)[Parallel + Always Spawn] 699.175 507.874 1.38 (NOT OK)[Parallel + Thread Pool + Spin] 832.174 193.913 4.29 (NOT OK)[Parallel + Thread Pool + Sleep] 10441.547 192.014 54.38 (NOT OK)================================================================================Executing test: math_operations_in_tight_for_loop_fewer_tasks_async...Reference binary: ./runtasks_ref_linuxResults for: math_operations_in_tight_for_loop_fewer_tasks_async STUDENT REFERENCE PERF?[Serial] 699.177 701.617 1.00 (OK)[Parallel + Always Spawn] 695.58 492.998 1.41 (NOT OK)[Parallel + Thread Pool + Spin] 821.325 116.941 7.02 (NOT OK)[Parallel + Thread Pool + Sleep] 130.087 107.359 1.21 (NOT OK)================================================================================Executing test: math_operations_in_tight_for_loop_fan_in_async...Reference binary: ./runtasks_ref_linuxResults for: math_operations_in_tight_for_loop_fan_in_async STUDENT REFERENCE PERF?[Serial] 360.279 360.273 1.00 (OK)[Parallel + Always Spawn] 359.416 103.933 3.46 (NOT OK)[Parallel + Thread Pool + Spin] 423.262 61.165 6.92 (NOT OK)[Parallel + Thread Pool + Sleep] 281.535 57.842 4.87 (NOT OK)================================================================================Executing test: math_operations_in_tight_for_loop_reduction_tree_async...Reference binary: ./runtasks_ref_linuxResults for: math_operations_in_tight_for_loop_reduction_tree_async STUDENT REFERENCE PERF?[Serial] 356.873 363.942 0.98 (OK)[Parallel + Always Spawn] 356.569 72.74 4.90 (NOT OK)[Parallel + Thread Pool + Spin] 420.686 58.409 7.20 (NOT OK)[Parallel + Thread Pool + Sleep] 64.009 55.38 1.16 (OK)================================================================================Executing test: spin_between_run_calls_async...Reference binary: ./runtasks_ref_linuxResults for: spin_between_run_calls_async STUDENT REFERENCE PERF?[Serial] 313.752 451.405 0.70 (OK)[Parallel + Always Spawn] 313.145 231.897 1.35 (NOT OK)[Parallel + Thread Pool + Spin] 365.605 257.833 1.42 (NOT OK)[Parallel + Thread Pool + Sleep] 164.641 233.714 0.70 (OK)================================================================================Executing test: mandelbrot_chunked_async...Reference binary: ./runtasks_ref_linuxResults for: mandelbrot_chunked_async STUDENT REFERENCE PERF?[Serial] 369.846 373.895 0.99 (OK)[Parallel + Always Spawn] 368.05 57.582 6.39 (NOT OK)[Parallel + Thread Pool + Spin] 415.671 60.354 6.89 (NOT OK)[Parallel + Thread Pool + Sleep] 61.402 53.752 1.14 (OK)================================================================================Overall performance results[Serial] : All passed Perf[Parallel + Always Spawn] : Perf did not pass all tests[Parallel + Thread Pool + Spin] : Perf did not pass all tests[Parallel + Thread Pool + Sleep] : Perf did not pass all tests注意除了 TaskSystemParallelThreadPoolSleeping,其余 task system 的异步实现均为 serial
有如下一些观察
- 同步版本的 run 由于多了 scheduler thread 这个间接层,性能会略微下降
- 部分测试用例,如
super_super_light_async和math_operations_in_tight_for_loop_async,性能惨不忍睹,分析如下
这两个测试的依赖关系都较为复杂,在 super_super_light_async 测试中,其依赖关系如下
在 math_operations_in_tight_for_loop_async 测试中,其依赖关系为一棵二叉树
并且这两个测试中的 task 体量并不算大,所以 scheduler thread 中维护的依赖关系会成为瓶颈
用 perf 对 super_super_light_async 跑个火焰图

可以发现 scheduler thread 中判断 runnable 占据了大部分时间
一种可能的改进方案是,通过某种方式,能够按照依赖关系对 task queue 进行拓扑排序,这样可以减少判断 runnable 的次数,具体可以参考 CGraph
Assignment 3
RTFM
https://docs.nvidia.com/cuda/cuda-c-programming-guide/
Environment Setup
白嫖 Google Colab
from google.colab import drivedrive.mount('/content/drive')!cd /content/drive/MyDrive/asst3-master/saxpy && make && ./cudaSaxpyPart 1: CUDA Warm-Up 1: SAXPY (5 pts)
参考 An Easy Introduction to CUDA C and C++ | NVIDIA Technical Blog 即可
结果如下
mkdir -p objs/nvcc saxpy.cu -O3 -m64 --gpu-architecture compute_35 -c -o objs/saxpy.onvcc warning : The 'compute_35', 'compute_37', 'compute_50', 'sm_35', 'sm_37' and 'sm_50' architectures are deprecated, and may be removed in a future release (Use -Wno-deprecated-gpu-targets to suppress warning).g++ -m64 -O3 -Wall -o cudaSaxpy objs/main.o objs/saxpy.o -L/usr/local/cuda/lib64/ -lcudart---------------------------------------------------------Found 1 CUDA devicesDevice 0: Tesla T4 SMs: 40 Global mem: 15110 MB CUDA Cap: 7.5---------------------------------------------------------Running 3 timing tests:Overall Kernel Duration 0.004634sKernel BW by CUDA saxpy: 4.634 ms [241.182 GB/s]Effective BW by CUDA saxpy: 266.717 ms [4.190 GB/s]Overall Kernel Duration 0.004607sKernel BW by CUDA saxpy: 4.607 ms [242.604 GB/s]Effective BW by CUDA saxpy: 286.075 ms [3.907 GB/s]Overall Kernel Duration 0.004610sKernel BW by CUDA saxpy: 4.610 ms [242.419 GB/s]Effective BW by CUDA saxpy: 283.091 ms [3.948 GB/s]如果只考虑 kernel execution 的时间,其性能远超 Assignment 3 的 Program 5
但是受限于 GPU 的内存带宽,cudaMemcpy 会消耗大量的时间
实际预测 Google Colab 中 Tesla T4 的内存带宽为 4 GB/s
Part 2: CUDA Warm-Up 2: Parallel Prefix-Sum (10 pts)
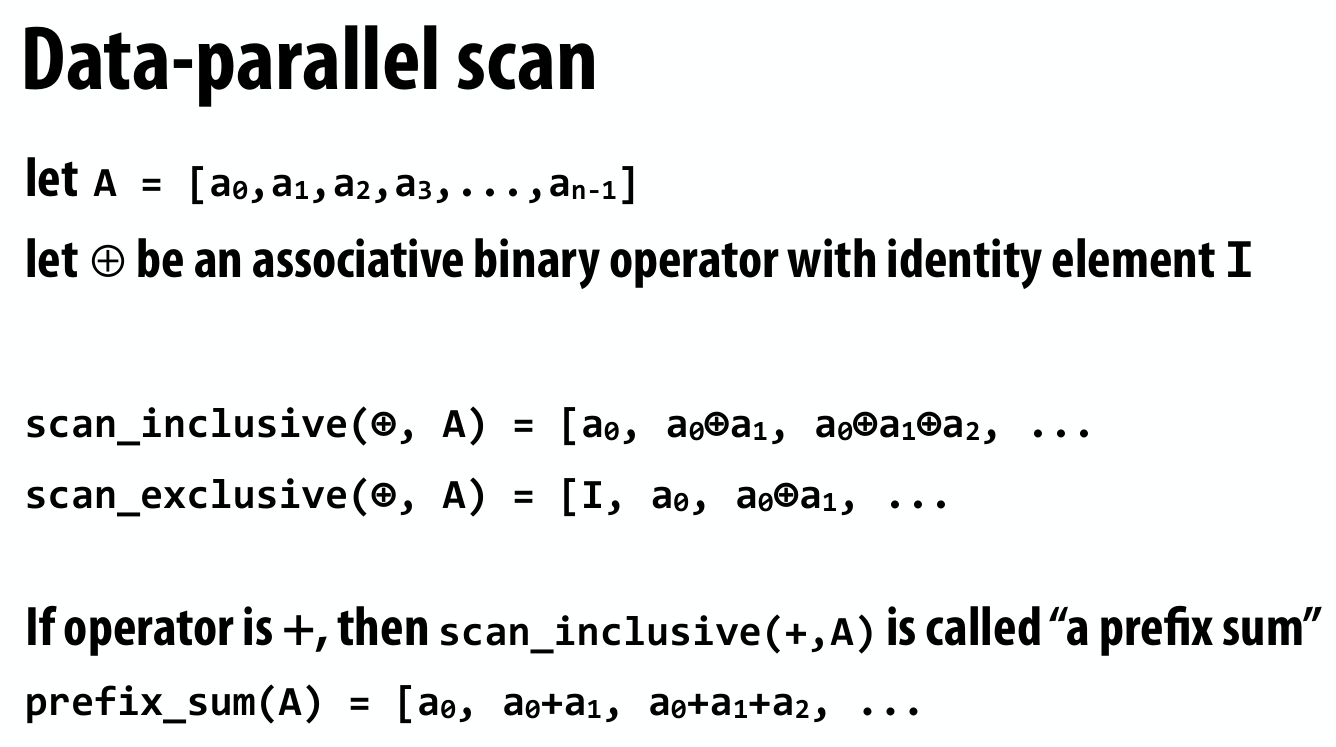
首先需要了解并行前缀和算法,参考
- https://gfxcourses.stanford.edu/cs149/fall22/lecture/dataparallel/
- https://stackoverflow.com/questions/10053629/parallel-prefix-sum-fastest-implementation
给出如下算法
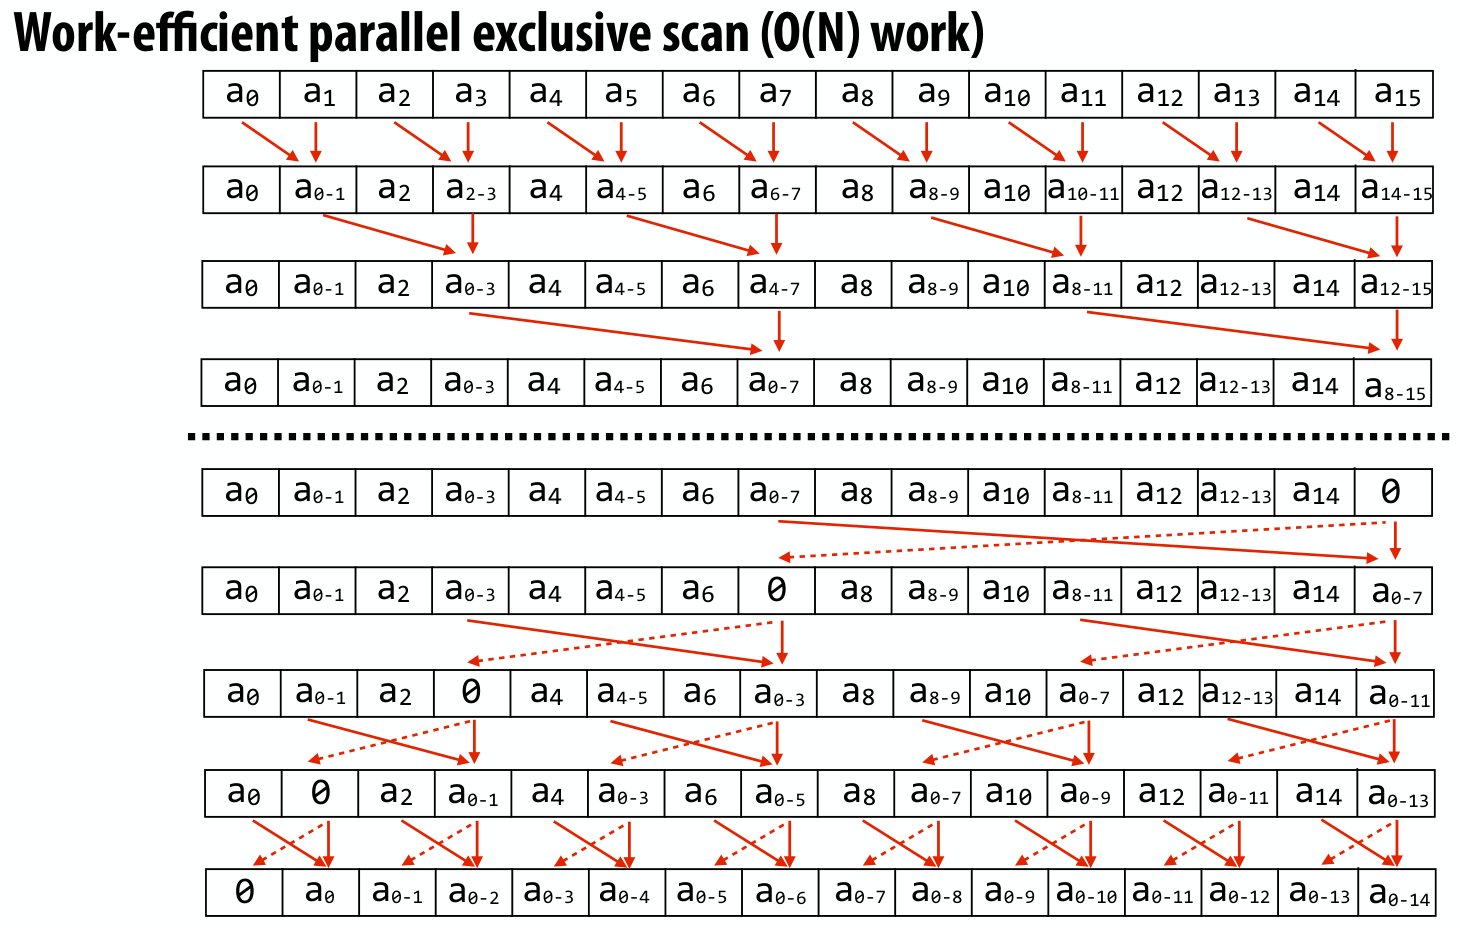
此处 exclusive scan 的含义如下
对于上述算法,串行版本的代码描述如下,此处定义二元运算为 +
void cpu_exclusive_scan(int *start, int *end, int *output) {  int N = end - start;  memmove(output, start, N * sizeof(int));
  // upsweep phase  for (int twod = 1; twod < N / 2; twod *= 2) {    int twod1 = twod * 2;
    for (int i = 0; i < N; i += twod1) {      output[i + twod1 - 1] = output[i + twod - 1] + output[i + twod1 - 1];    }  }
  output[N - 1] = 0;
  // downsweep phase  for (int twod = N / 2; twod >= 1; twod /= 2) {    int twod1 = twod * 2;    for (int i = 0; i < N; i += twod1) {      int tmp = output[i + twod - 1];      output[i + twod - 1] = output[i + twod1 - 1];      output[i + twod1 - 1] = tmp + output[i + twod1 - 1];    }  }}
需要利用 cuda 实现其并行版本,考虑到外层 for 循环的不同迭代之间存在依赖,而内层 for 循环的不同迭代之间是相互独立的,于是考虑 launch kernel 函数替换内层 for 循环的计算,有如下要点
- 关于 blocks 和 threads per block 的计算,此处固定
THREADS_PER_BLOCK为 256,而 blocks 为迭代总次数 / THREADS_PER_BLOCK - 在 kernel 函数中利用
blockIdx.x * blockDim.x + threadIdx.x索引到对应的下标,当 array size 较大时存在 int 溢出的可能,所以考虑使用__uint64_t - 对于 device memory 中的 array,host 端不能直接通过下标访问,否则 cuda 会 fail silently and return an error code
- 考虑使用下述代码捕获 cuda 中出现的错误
#define DEBUG
#ifdef DEBUG#define cudaCheckError(ans) { cudaAssert((ans), __FILE__, __LINE__); }inline void cudaAssert(cudaError_t code, const char *file, int line, bool abort=true){ if (code != cudaSuccess) { fprintf(stderr, "CUDA Error: %s at %s:%d\n", cudaGetErrorString(code), file, line); if (abort) exit(code); }}#else#define cudaCheckError(ans) ans#endif- kernel 代码的执行是异步的,需要通过
cudaDeviceSynchronize显式同步,而cudaMemcpy是同步的,更多可以参考 https://docs.nvidia.com/cuda/cuda-runtime-api/api-sync-behavior.html
下面需要利用 exclusive scan 实现 find_repeats 方法,即
Given a list of integers A, returns a list of all indices i for which A[i] == A[i+1].For example, given the array {1,2,2,1,1,1,3,5,3,3}, your program should output the array {1,3,4,8}.此处 parallel exclusive scan 的作用是并行的获取满足条件的 index
仍然考虑上述例子,定义 array B,若 A[i] == A[i+1],则置 B[i] = 1,否则置 B[i] = 0
B = {0,1,0,1,1,0,0,0,1,0}定义 array C = exclusive_scan(+,B)
C = {0,0,1,1,2,3,3,3,3,4}那么,对于 output array O,当 B[i] = 1 时,只需置 O[C[i]] = i 即可,并且 length(O) = C[length(C)-1]
注意对于不同的 i,上述操作是相互独立的,所以可以通过 launch kernel 函数高效的实现
最终的性能结果如下
-------------------------Scan Score Table:--------------------------------------------------------------------------------------------------| Element Count   | Ref Time        | Student Time    | Score           |-------------------------------------------------------------------------| 1000000         |                 | 0.824           | 0               || 10000000        |                 | 8.094           | 0               || 20000000        |                 | 15.541          | 0               || 40000000        |                 | 30.654          | 0               |-------------------------------------------------------------------------|                                   | Total score:    | 0/5             |-------------------------------------------------------------------------
-------------------------Find_repeats Score Table:--------------------------------------------------------------------------------------------------| Element Count   | Ref Time        | Student Time    | Score           |-------------------------------------------------------------------------| 1000000         |                 | 1.306           | 0               || 10000000        |                 | 10.950          | 0               || 20000000        |                 | 19.956          | 0               || 40000000        |                 | 38.701          | 0               |-------------------------------------------------------------------------|                                   | Total score:    | 0/5             |-------------------------------------------------------------------------
由于 ref 程序版本不兼容
UP WARNING: A CUDA error occurred: code=222, the provided PTX was compiled with an unsupported toolchain. 42与 README.md 中的数据对比,性能差距不大
Part 3: A Simple Circle Renderer (85 pts)
TODO
Assignment 4
Ref
https://github.com/aksbaih/cs149-asst4
RTFM
- The OpenMP 3.0 specification: http://www.openmp.org/mp-documents/spec30.pdf
- An OpenMP cheat sheet http://openmp.org/mp-documents/OpenMP3.1-CCard.pdf
访问 https://www.openmp.org/specifications/ 获取最新的 specifications
-
OpenMP has support for reductions on shared variables, and for declaring thread-local copies of variables
-
This is a nice guide for the
omp parallel_fordirectives: http://www.inf.ufsc.br/~bosco.sobral/ensino/ine5645/OpenMP_Dynamic_Scheduling.pdf
OpenMP for automatically splits for loop iterations for us.
But, depending on our program, the default behavior may not be ideal.
For loops where each iteration takes roughly equal time, static schedules work best, as they have little overhead.
For loops where each iteration can take very different amounts of time, dynamic schedules, work best as the work will be split more evenly across threads.
Specifying chunks, or using a guided schedule provide a trade-off (uma alternativa) between the two.
Choosing the best schedule depends on understanding your loop.
Jaka’s Corner OpenMP series
- OpenMP: Introduction
- OpenMP: For
- OpenMP: Sections
- OpenMP: Monte Carlo method for Pi
- OpenMP: For & Reduction
- OpenMP: For & Scheduling
- OpenMP: Data-Sharing Rules
- OpenMP: default(none) and const variables
- OpenMP: Barrier
- OpenMP: Critical construct and zero matrix entries
- OpenMP: Thread cancellation model
Environment Setup
安装 OpenMP
install openmp使用 cmake 构建
https://cliutils.gitlab.io/modern-cmake/chapters/packages/OpenMP.html
Representing Graphs
有向图,其数据分布比较紧凑
struct graph{    // Number of edges in the graph    int num_edges;    // Number of vertices in the graph    int num_nodes;
    // The node reached by vertex i's first outgoing edge is given by    // outgoing_edges[outgoing_starts[i]].  To iterate over all    // outgoing edges, please see the top-down bfs implementation.    int* outgoing_starts;    Vertex* outgoing_edges;
    int* incoming_starts;    Vertex* incoming_edges;};
顶点编号范围为 0 ~ num_nodes - 1
对于顶点 i,其所有出边的另一个顶点编号存储在 outgoing_edges[j] 中,其中 j 的范围为 outgoing_starts[i] ~ outgoing_starts[i+1]-1
本质上是 gather 和 scatter 操作
Page Rank
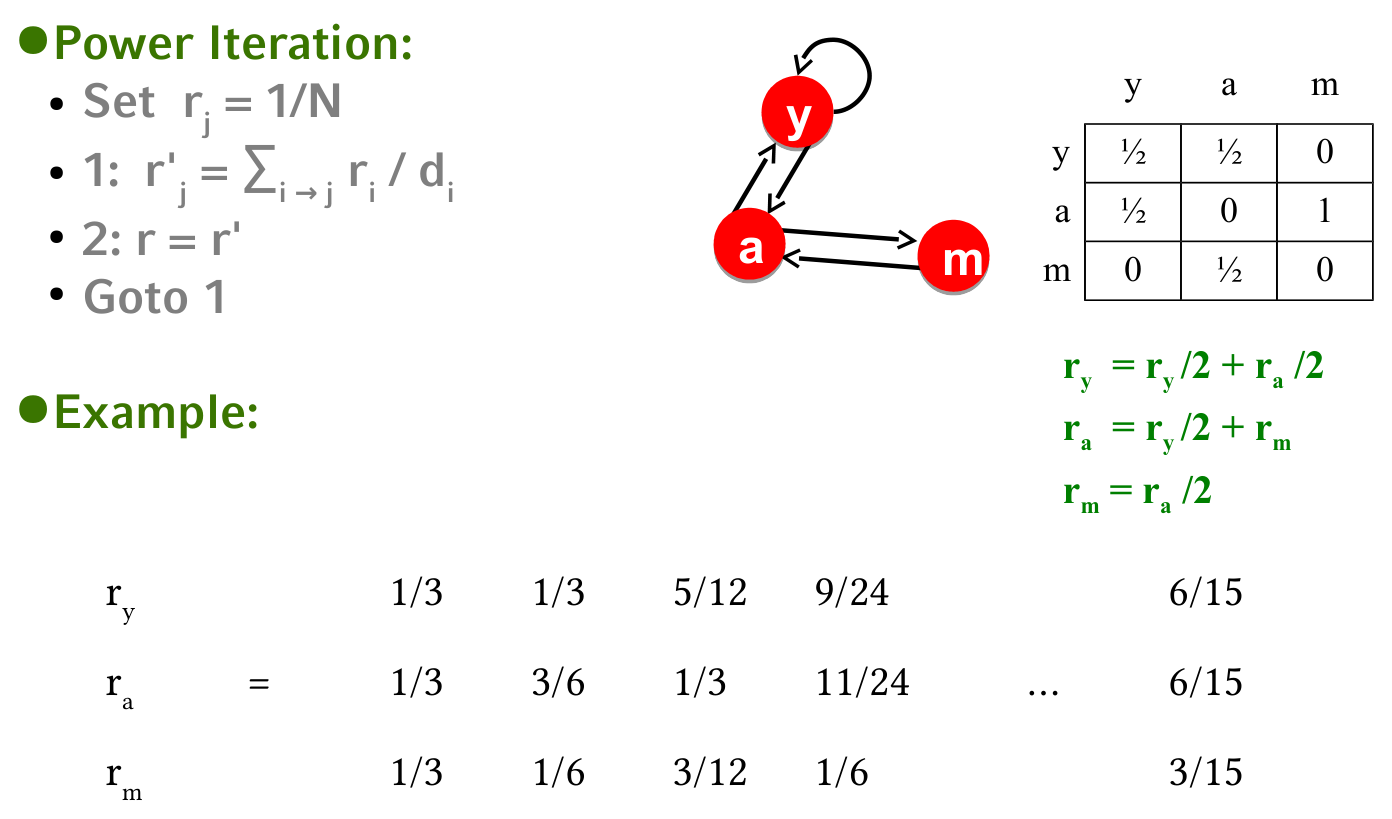
Algorithm
首先介绍一下 Page Rank 算法,该算法用于评估网页重要性,在这里
- 顶点代表网页
- 代表网页之间的链接 (link)
Page Rank 算法的核心思想是 page is more important if it has more in-links
由此定义网页重要性 rank
其中 代表网页 的出链数量
不难发现上述定义是一个递归定义,我们约定递归的初始条件为
其中 代表顶点的总数
实际上可以将上述转移关系写成矩阵的形式,那么有
下面是一个例子
然而,在实际中,上述算法会遇到如下问题
- Some pages are dead ends (have no out-links)
这些 pages 会导致网页重要性流失
可以假设这些 pages 包含所有网页的链接
- Spider traps (all out-links are within a group)
这些 pages 会最终吸收掉所有的网页重要性
可以假设在一定概率下跳出这个 group,随机前往任意一个网页
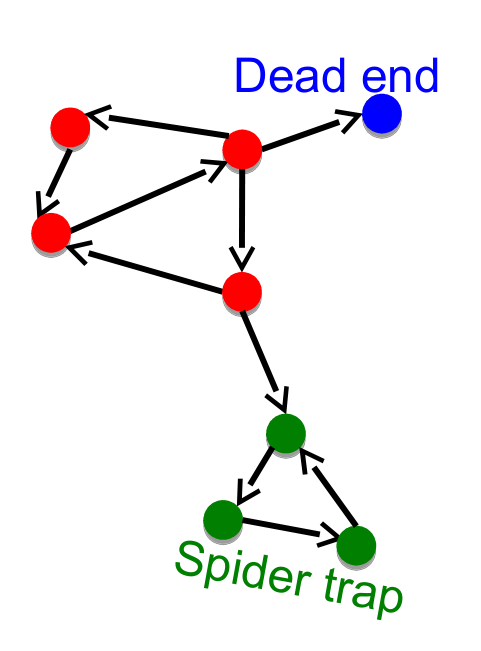
于是可以将上述转移关系修改为
这里 代表没有出链的网页数量
在实际的代码中,damping 代表了参数 ,convergence 代表了收敛阈值
然而,上述算法并不能保证最终的结果能够收敛,取决于具体图的性质
Implementation
首先下载图数据 http://cs149.stanford.edu/cs149asstdata/all_graphs.tgz
main.cpp 对应 pr,需要传入完整的数据路径,grade.cpp 对应 pr_grader 需要传入数据所在的目录
./pr ~/Desktop/shared/graphs/tiny.graph 8./pr_grader ~/Desktop/shared/graphs/上述算法的串行实现是 trivial 的
为了提升性能,有如下一些要点
- 提前计算没有出链的顶点编号,提前计算每一轮迭代对应的 项
- 每一轮迭代中的大循环使用
#pragma omp parallel for schedule(dynamic, 256),若使用schedule(dynamic)性能会较差 - 对于
global_diff的计算,另起一个循环#pragma omp parallel for reduction(+ : global_diff),避免在大循环中引起数据竞争
Result
实际上感觉导入时间远大于计算时间
> ./pr ~/Desktop/shared/graphs/com-orkut_117m.graph----------------------------------------------------------Max system threads = 8----------------------------------------------------------Loading graph...
Graph stats:  Edges: 117185083  Nodes: 3072441----------------------------------------------------------Running with 1 threadsTesting Correctness of Page Rank----------------------------------------------------------Running with 2 threadsTesting Correctness of Page Rank----------------------------------------------------------Running with 4 threadsTesting Correctness of Page Rank----------------------------------------------------------Running with 8 threadsTesting Correctness of Page Rank----------------------------------------------------------Your Code: Timing SummaryThreads  Time (Speedup)   1:   6.7025 (1.0000x)   2:   3.5078 (1.9108x)   4:   2.0653 (3.2452x)   8:   1.2832 (5.2234x)----------------------------------------------------------Reference: Timing SummaryThreads  Time (Speedup)   1:   6.2877 (1.0000x)   2:   4.2482 (1.4801x)   4:   2.5614 (2.4548x)   8:   1.7962 (3.5005x)----------------------------------------------------------Correctness:
Relative Speedup to Reference:Threads  Speedup   1:     0.94x   2:     1.21x   4:     1.24x   8:     1.40x
> ./pr_grader ~/Desktop/shared/graphs/Max system threads = 8Running with 8 threads
Graph: soc-livejournal1_68m.graphref_time: 2.99031sstu_time: 1.46187s
Graph: com-orkut_117m.graphref_time: 1.92497sstu_time: 1.31045s
Graph: rmat_200m.graphref_time: 16.1516sstu_time: 12.896s

-------------------------------------------SCORES :-------------------------------------------soc-livejournal1_68m.graph  |   4.00000 / 4 |-------------------------------------------com-orkut_117m.graph        |   4.00000 / 4 |-------------------------------------------rmat_200m.graph             |   4.00000 / 4 |-------------------------------------------TOTAL                       |   12.00000 / 12 |-------------------------------------------
pr_grader 并未测试 random_500m.graph,因为内存不够了
Breadth-First Search
Top Down
框架代码使用了下述数据结构描述 BFS 过程中的 frontier
struct vertex_set { // # of vertices in the set int count; // max size of buffer vertices int max_vertices; // array of vertex ids in set int *vertices;};需要将 top_down_step 这个函数并行化,思路如下
- 多个线程遍历不同顶点的 neighbors,其中可能发生数据竞争的唯一场景是,一个顶点同时是多个顶点的 neighbor,需要判断该顶点是否已经被访问过
- 由于 BFS 的特性,每一轮被新访问的顶点,实际上对应的 distance (与根顶点的距离) 都是相同的,无论该顶点是之前一轮哪个顶点的 neighbor
- 考虑到 OpenMP 的最大线程数基本上等于
nproc,所以可以使用nproc个线程遍历不同顶点的 neighbors,每个线程维护一个大小上限为 的vertex_set,作为新一轮的 local frontier,其中 为总顶点数 - 使用 CAS 指令判断 neighbor 顶点是否已经被访问过,若已经被访问过,则直接跳过即可,对应的原语可以参考 https://gcc.gnu.org/onlinedocs/gcc-4.1.2/gcc/Atomic-Builtins.html
- 最后将
nproc个新一轮的 local frontier 汇总为 global frontier,作为新一轮的 frontier
对于 OpenMP 的使用,有几个要点
#pragma omp parallel和#pragma omp for
具体含义如下
- The
parallelconstruct specifies the region which should be executed in parallel. A program without the parallel construct will be executed sequentially. - The
forloop construct (or simply the loop construct) specifies that the iterations of the following for loop will be executed in parallel. The iterations are distributed across the threads that already exist.
#pragma omp parallel [clauses]{ // parallel region #pragma omp for [clauses] for (...) { // body }}实际上 #pragma omp parallel for 是 #pragma omp parallel 和 #pragma omp for 的简写,也就是当 parallel region 中只有一个 #pragma omp for 时,例如
#pragma omp parallel for [clauses]for (...){ // body}default(none)子句
The
default(none)clause forces a programmer to explicitly specify the data-sharing attributes of all variables in a parallel region. Using this clause then forces the programmer to think about data-sharing attributes.
clang-tidy 会默认检测 #pragma omp parallel 中是否使用了 default(none)
当使用了 default(none) 后,对于线程间共享的变量,需要显式在 shared clause 中指出
在 parallel region 中定义的变量,OpenMP 认为是线程私有变量,例如上述的 local frontier
使用了
default(none)子句后,感觉性能提升了一些
- 临界区保护
考虑使用 #pragma omp atomic capture
#pragma omp atomic capture structured-block在实际使用中,这里的 structured-block 为
{ v = x; x binop= expr;}其中 v 和 expr 为线程私有变量,而 x 为线程共享变量
也可以使用 #pragma omp critical,具体 RTFM
Bottom Up
伪代码如下
for each vertex v in graph: if v has not been visited AND v shares an incoming edge with a vertex u on the frontier: add vertex v to (new) frontier;实际上无需记录 frontier 的顶点编号,只需记录其存在性即可
于是考虑使用下述数据结构描述 BFS 过程中的 frontier
struct vertex_bitmap { int count; bool *visited;};这里比较关键的地方在于,每一轮被新访问的顶点不应该作为这一轮的 frontier,而是下一轮的 frontier,换句话说,Bottom Up 和 Top Down 在每一轮所得到的 frontier 应该是一致的
数据竞争方面,只需 reduce new_bitmap_count 这个变量即可,其余过程线程间是独立的
Hybrid
需要结合 Top Down 和 Bottom Up 两种策略的优势
- 在 frontier 的 count 比较小时,Top Down 更快
- 在 frontier 的 count 比较大时,Bottom Up 更快
理想情况下,在 BFS 的过程中,随着轮数增加,frontier 的 count 应该是先变大,再变小
于是考虑下述策略
- 在开始的时候采用 Top Down 策略
- 当 frontier 的 count 增加到某个阈值后,采用 Bottom Up 策略
由于两种策略的转换之间存在开销,并且从 Top Down 策略转换为 Bottom Up 策略的开销要小于从 Bottom Up 策略转换为 Top Down 策略的开销
因为目前的
vertex_bitmap并未显式记录 frontier 的顶点编号
所以考虑仅使用一次转换
下面讨论阈值的选择,在有向完全图的假设下,一轮 Top Down 所需要访问的顶点个数为
一轮 Bottom Up 所需要访问的顶点个数为
于是将阈值设定为 ,其中 代表顶点的总数
Result
> ./bfs ~/Desktop/shared/graphs/com-orkut_117m.graph----------------------------------------------------------Max system threads = 8----------------------------------------------------------Loading graph...
Graph stats:  Edges: 117185083  Nodes: 3072441----------------------------------------------------------Running with 1 threadsTesting Correctness of Top DownTesting Correctness of Bottom Up[Switching to bottom up mode with frontier=777010]Testing Correctness of Hybrid----------------------------------------------------------Running with 2 threadsTesting Correctness of Top DownTesting Correctness of Bottom Up[Switching to bottom up mode with frontier=777010]Testing Correctness of Hybrid----------------------------------------------------------Running with 4 threadsTesting Correctness of Top DownTesting Correctness of Bottom Up[Switching to bottom up mode with frontier=777010]Testing Correctness of Hybrid----------------------------------------------------------Running with 8 threadsTesting Correctness of Top DownTesting Correctness of Bottom Up[Switching to bottom up mode with frontier=777010]Testing Correctness of Hybrid----------------------------------------------------------Your Code: Timing SummaryThreads  Top Down          Bottom Up         Hybrid   1:    0.38 (1.00x)      0.50 (1.00x)      0.05 (1.00x)   2:    0.27 (1.44x)      0.25 (2.05x)      0.03 (1.65x)   4:    0.16 (2.35x)      0.14 (3.68x)      0.02 (2.48x)   8:    0.10 (3.84x)      0.10 (4.93x)      0.02 (3.25x)----------------------------------------------------------Reference: Timing SummaryThreads  Top Down          Bottom Up         Hybrid   1:    0.38 (1.00x)      0.50 (1.00x)      0.07 (1.00x)   2:    0.23 (1.65x)      0.25 (2.01x)      0.07 (1.10x)   4:    0.16 (2.32x)      0.15 (3.38x)      0.06 (1.27x)   8:    0.15 (2.61x)      0.10 (5.19x)      0.05 (1.46x)----------------------------------------------------------Correctness:
Speedup vs. Reference:Threads       Top Down          Bottom Up             Hybrid   1:             0.99               1.01               1.37   2:             0.86               1.02               2.05   4:             1.00               1.10               2.67   8:             1.46               0.96               3.06
> ./bfs_grader ~/Desktop/shared/graphsMax system threads = 8Running with 8 threads
Graph: grid1000x1000.graph
Top down bfsref_time: 0.0333177sstu_time: 0.214779s
Bottom up bfsref_time: 0.719265sstu_time: 0.703228s
Hybrid bfsref_time: 0.292586sstu_time: 0.198405s
Graph: soc-livejournal1_68m.graph
Top down bfsref_time: 0.144646sstu_time: 0.104211s
Bottom up bfsref_time: 0.0981488sstu_time: 0.125747s
Hybrid bfs[Switching to bottom up mode with frontier=1174905]ref_time: 0.0638454sstu_time: 0.0495188s
Graph: com-orkut_117m.graph
Top down bfsref_time: 0.172277sstu_time: 0.0954649s
Bottom up bfsref_time: 0.110134sstu_time: 0.10408s
Hybrid bfs[Switching to bottom up mode with frontier=777010]ref_time: 0.0509855sstu_time: 0.0175802s
Graph: rmat_200m.graph
Top down bfsref_time: 1.60406sstu_time: 1.58742s
Bottom up bfsref_time: 1.00752sstu_time: 1.13439s
Hybrid bfs[Switching to bottom up mode with frontier=10172240]ref_time: 0.756962sstu_time: 0.886052s

--------------------------------------------------------------------------SCORES : | Top-Down | Bott-Up | Hybrid |--------------------------------------------------------------------------grid1000x1000.graph | 0.40 / 2 | 3.00 / 3 | 3.00 / 3 |--------------------------------------------------------------------------soc-livejournal1_68m.graph | 2.00 / 2 | 3.00 / 3 | 3.00 / 3 |--------------------------------------------------------------------------com-orkut_117m.graph | 2.00 / 2 | 3.00 / 3 | 3.00 / 3 |--------------------------------------------------------------------------rmat_200m.graph | 7.00 / 7 | 8.00 / 8 | 8.00 / 8 |--------------------------------------------------------------------------TOTAL | 45.40 / 47 |--------------------------------------------------------------------------同上,bfs_grader 并未测试 random_500m.graph,因为内存不够了